




East Nashville neighborhoods
A card for each boundary Matthew drew and saved in the RealTracs MLS — 29 of 29 have a report for September 2026. Each card opens that neighborhood's own page: the same five numbers, the month number by number, every data set as a graph, and a page for every month. Back to East Nashville.
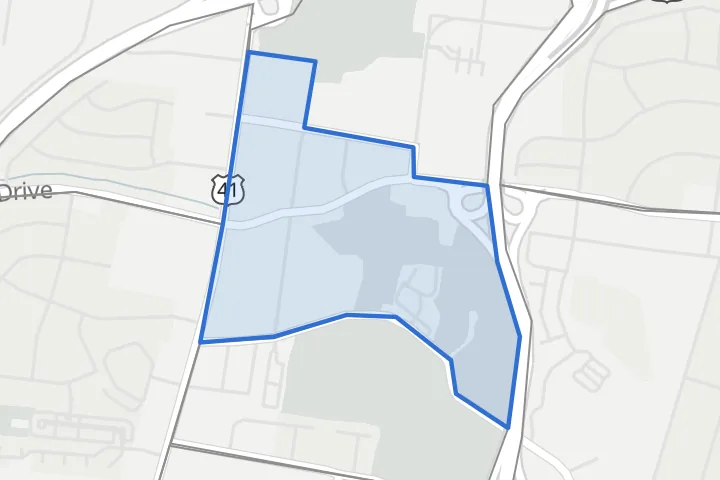
Broadmoor
$399,950 median sale price, 12-month rolling
−12.8% vs. a year earlier · 1 sold · 8.15 months of supply
Open Broadmoor →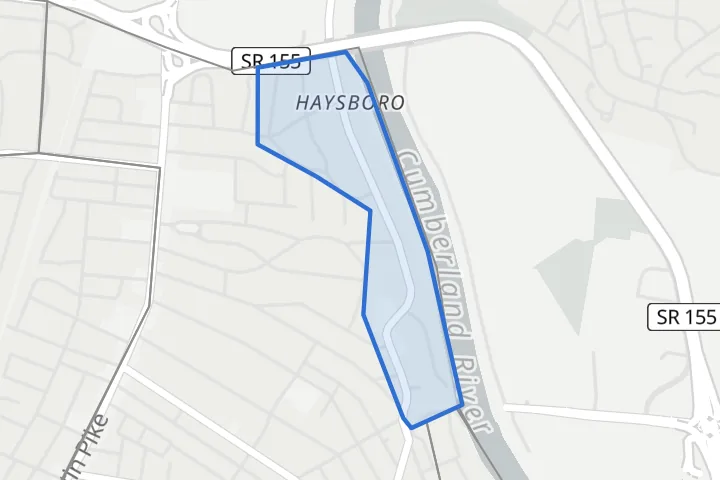
Brush Hill
$683,500 median sale price, 12-month rolling
−14.3% vs. a year earlier · 0 sold · 2.69 months of supply
Open Brush Hill →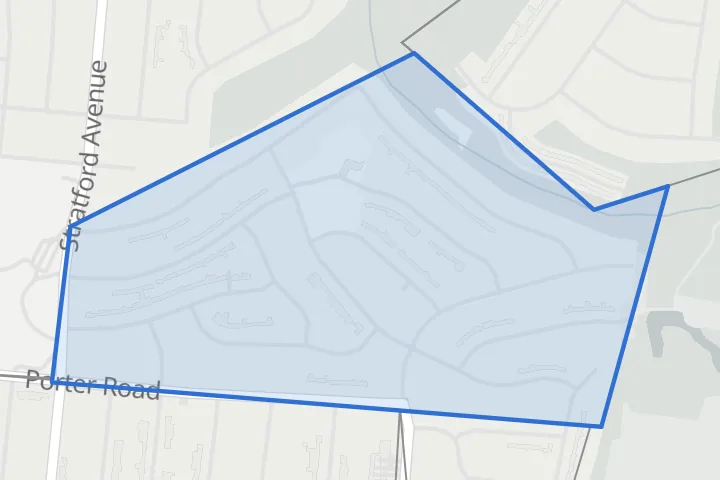
Burchwood Gardens
$575,000 median sale price, 12-month rolling
−10.9% vs. a year earlier · 2 sold · 4.12 months of supply
Open Burchwood Gardens →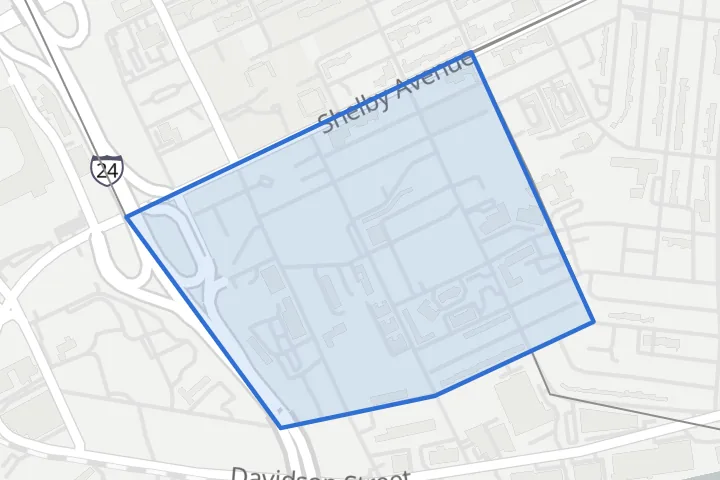
Cayce Homes
No sales in the month
0 sold
Open Cayce Homes →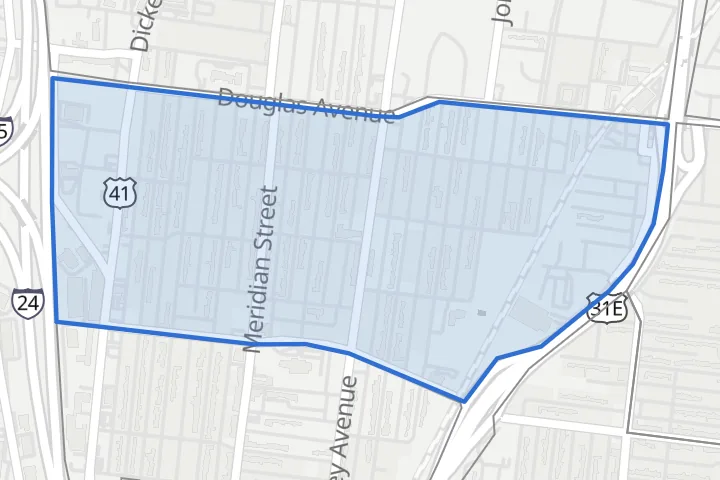
Cleveland Park
$770,000 median sale price, 3-month rolling
+47.4% vs. a year earlier · 4 sold · 8.31 months of supply
Open Cleveland Park →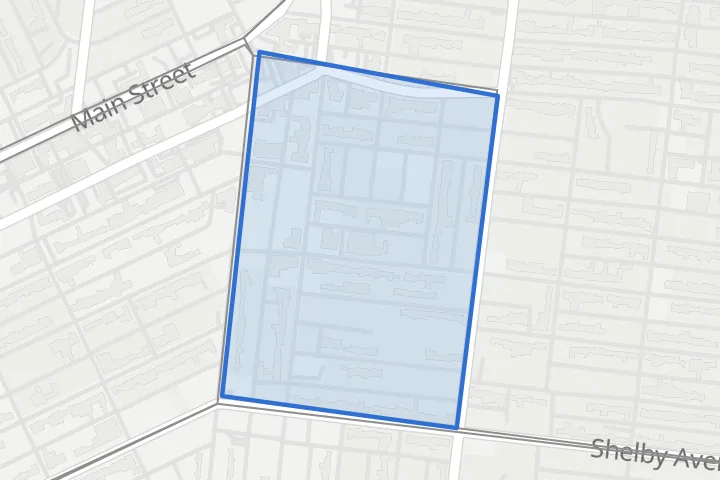
East End
$807,500 median sale price, 12-month rolling
−20.7% vs. a year earlier · 2 sold · 2.87 months of supply
Open East End →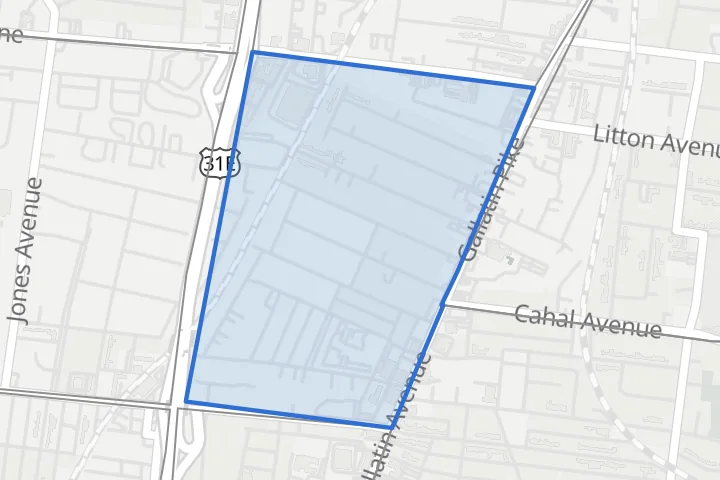
East Hill
$589,500 median sale price, 3-month rolling
−8.9% vs. a year earlier · 3 sold · 6.08 months of supply
Open East Hill →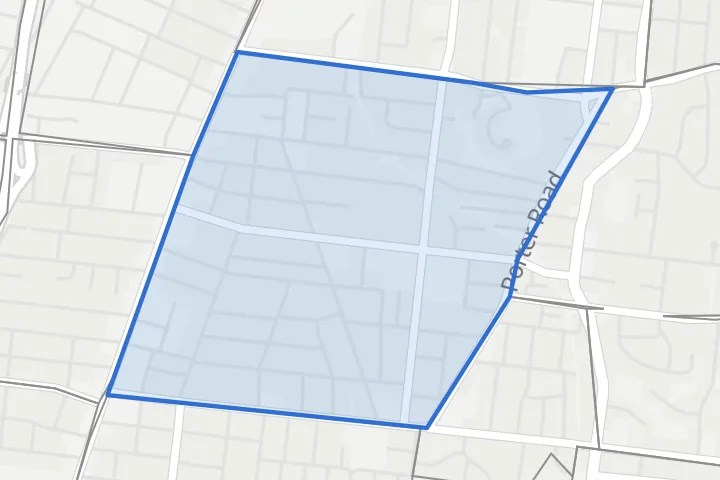
Eastwood
$720,000 median sale price, 3-month rolling
−7.4% vs. a year earlier · 5 sold · 4.79 months of supply
Open Eastwood →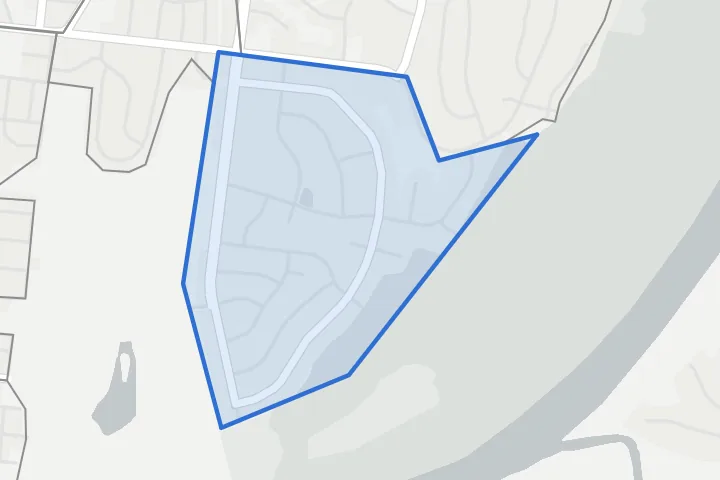
Fortland Farms
$1,040,014 median sale price, 3-month rolling
+38.7% vs. a year earlier · 2 sold · 2.5 months of supply
Open Fortland Farms →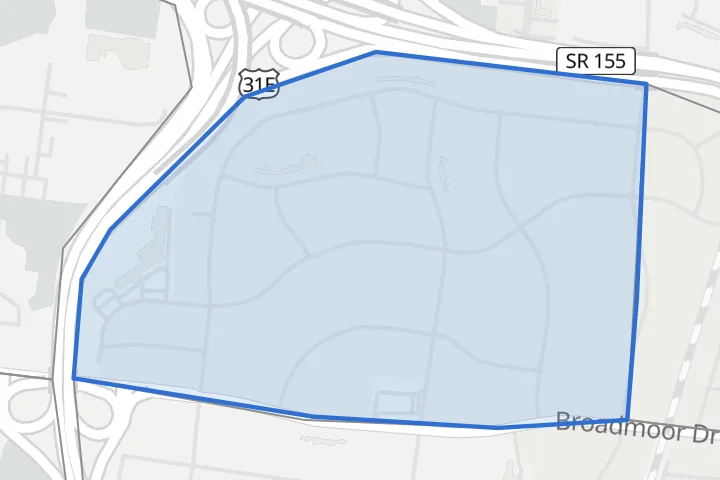
Gra-Mar
$535,000 median sale price, 12-month rolling
+13.3% vs. a year earlier · 2 sold · 4.59 months of supply
Open Gra-Mar →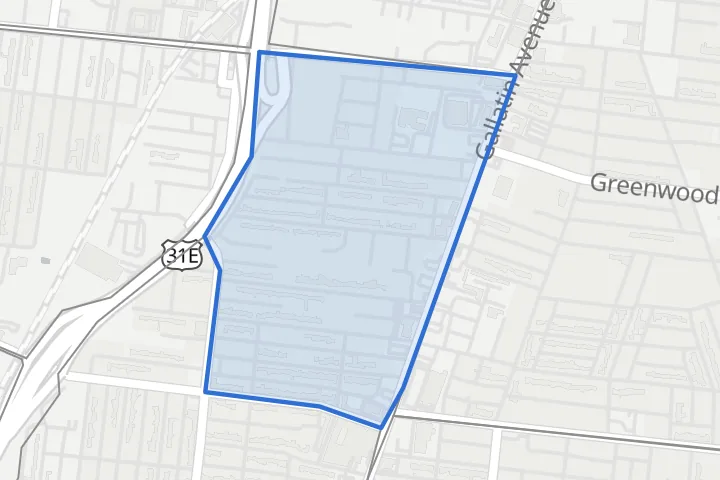
Greenwood
$522,450 median sale price, 12-month rolling
−30.6% vs. a year earlier · 1 sold · 6.08 months of supply
Open Greenwood →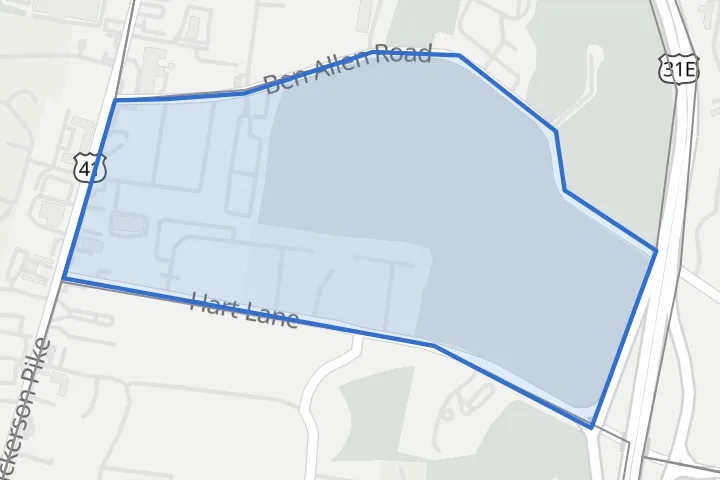
Hart Lane
$443,440 median sale price, 3-month rolling
−11.2% vs. a year earlier · 4 sold · 2.71 months of supply
Open Hart Lane →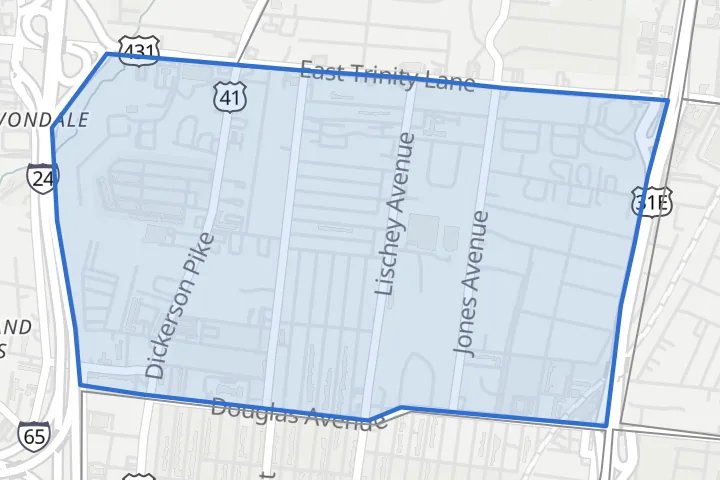
Highland Heights
$610,800 median sale price, 3-month rolling
+1.4% vs. a year earlier · 2 sold · 7.36 months of supply
Open Highland Heights →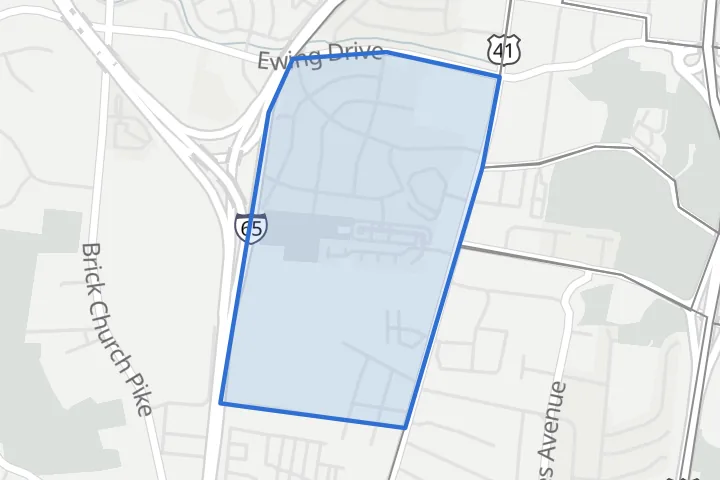
Hillhurst
$390,500 median sale price, 12-month rolling
+2.8% vs. a year earlier · 0 sold · 4.62 months of supply
Open Hillhurst →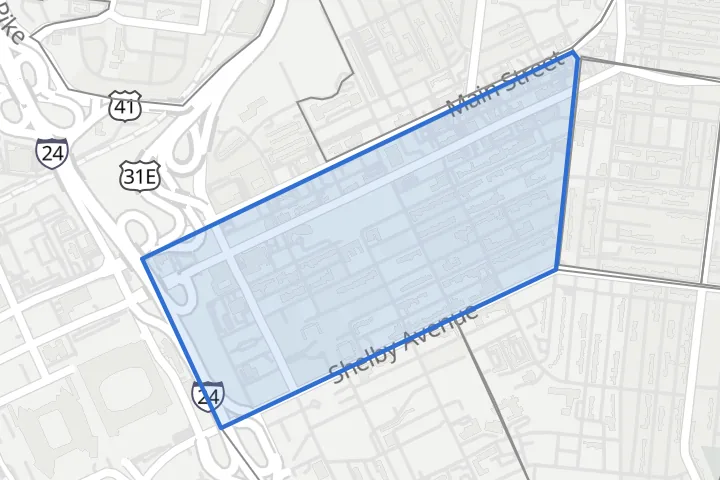
Historic Edgefield
$1,052,500 median sale price, 12-month rolling
+9.1% vs. a year earlier · 0 sold · 4.7 months of supply
Open Historic Edgefield →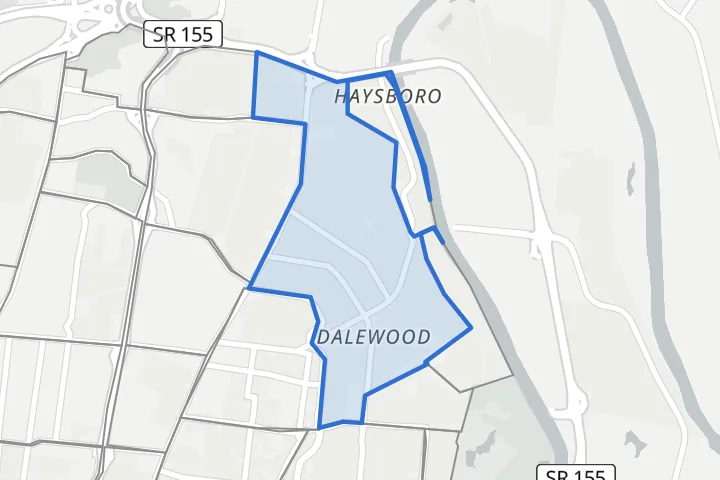
Inglewood
$544,000 median sale price, 3-month rolling
−1.1% vs. a year earlier · 9 sold · 3.32 months of supply
Open Inglewood →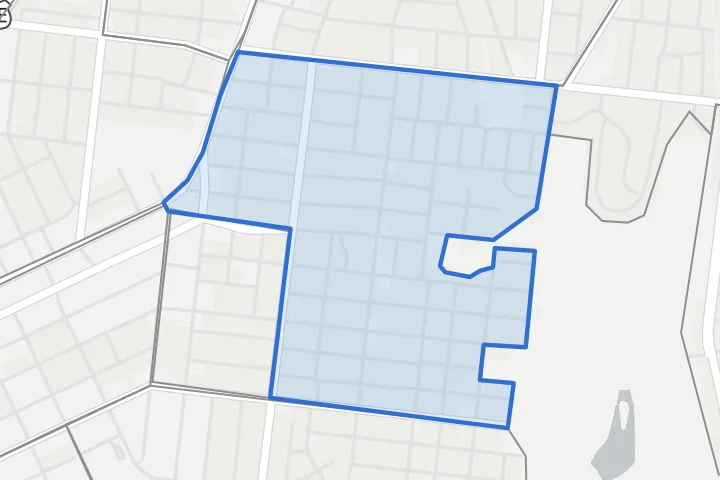
Lockeland Springs
$962,000 median sale price, 3-month rolling
+37.9% vs. a year earlier · 5 sold · 2.76 months of supply
Open Lockeland Springs →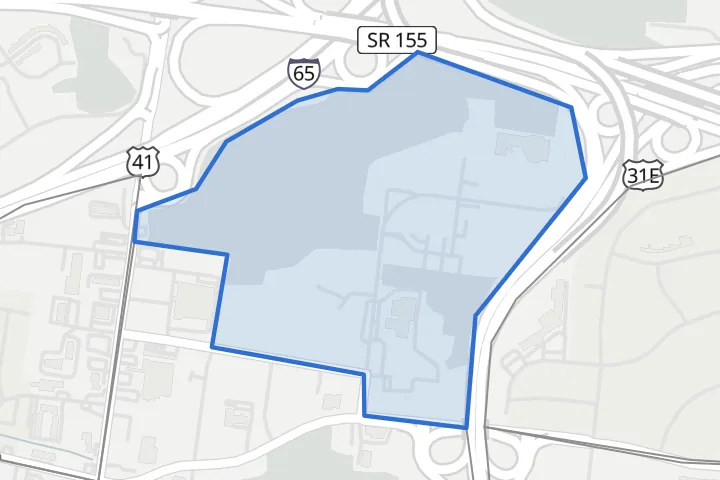
Maplewood
$434,900 median sale price, 12-month rolling
−5.9% vs. a year earlier · 1 sold · 3.02 months of supply
Open Maplewood →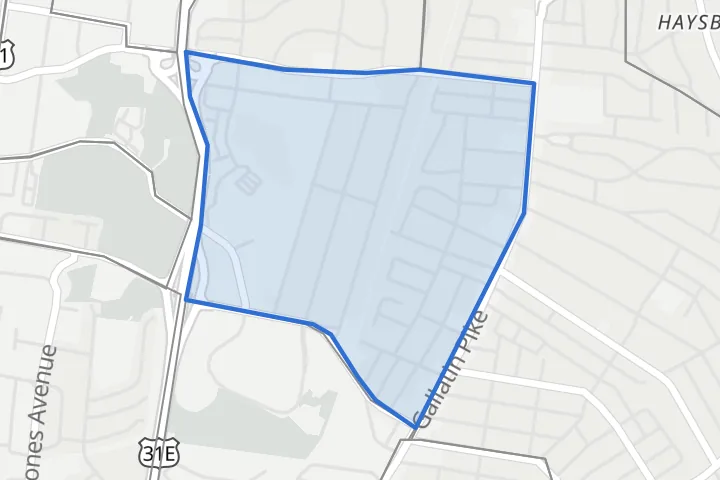
Maplewood Heights
$499,000 median sale price, 3-month rolling
+1.1% vs. a year earlier · 8 sold · 5.22 months of supply
Open Maplewood Heights →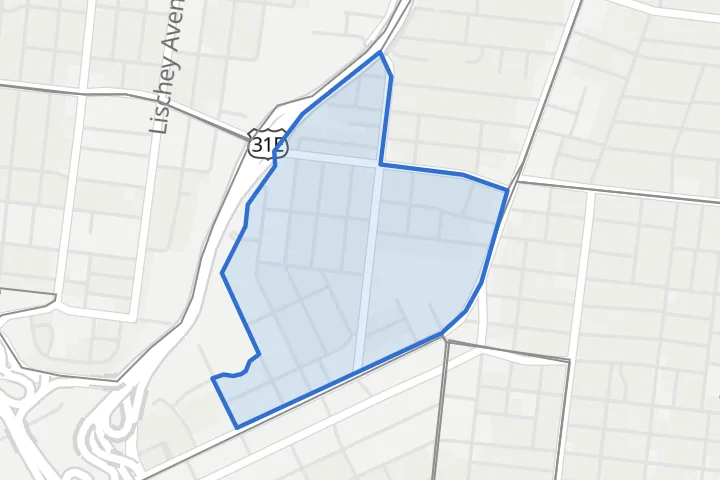
Maxwell Heights
$690,000 median sale price, 12-month rolling
+14.9% vs. a year earlier · 1 sold · 7.62 months of supply
Open Maxwell Heights →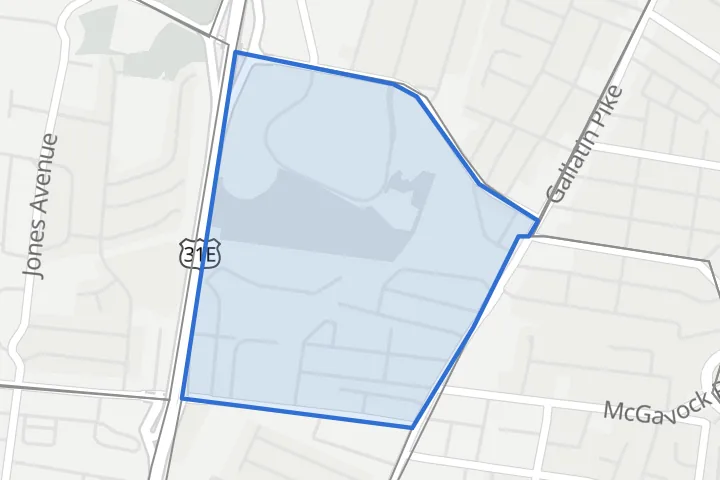
Maynor Place
$625,000 median sale price, 12-month rolling
+14.3% vs. a year earlier · 1 sold · 7.13 months of supply
Open Maynor Place →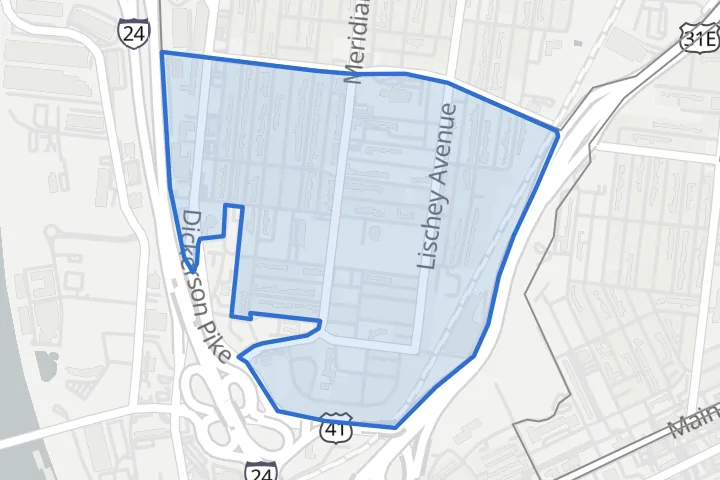
McFerrin Park
$620,000 median sale price, 12-month rolling
+4.2% vs. a year earlier · 0 sold · 5.62 months of supply
Open McFerrin Park →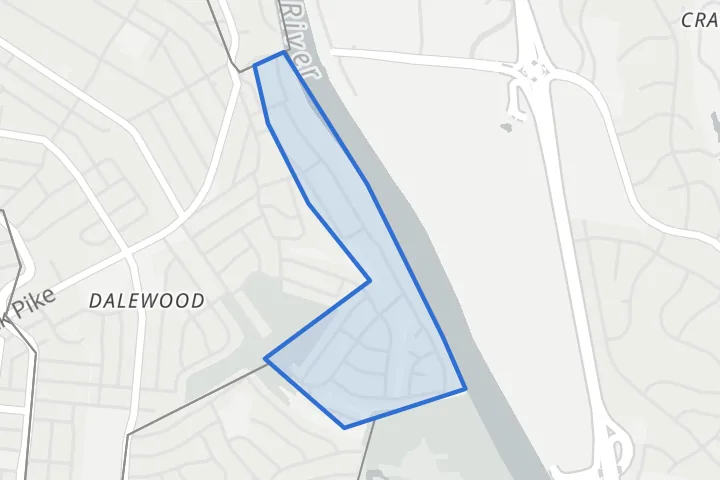
Moss Rose
$488,500 median sale price, 12-month rolling
−9.4% vs. a year earlier · 1 sold · 2.74 months of supply
Open Moss Rose →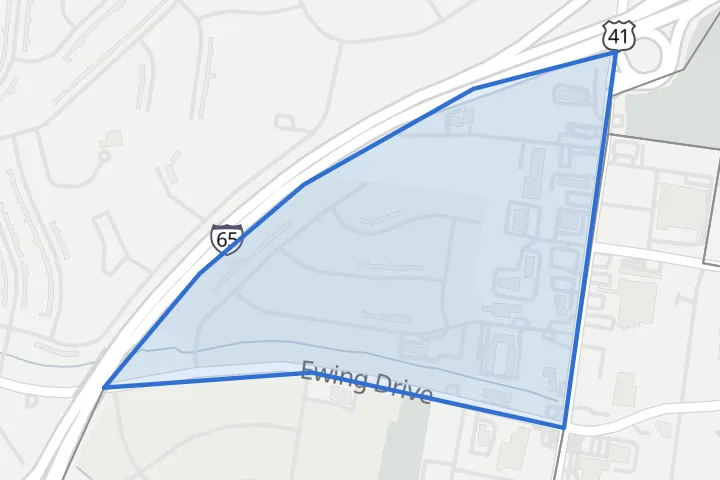
Oak Valley
$390,000 median sale price, 12-month rolling
−7.1% vs. a year earlier · 0 sold · 4.41 months of supply
Open Oak Valley →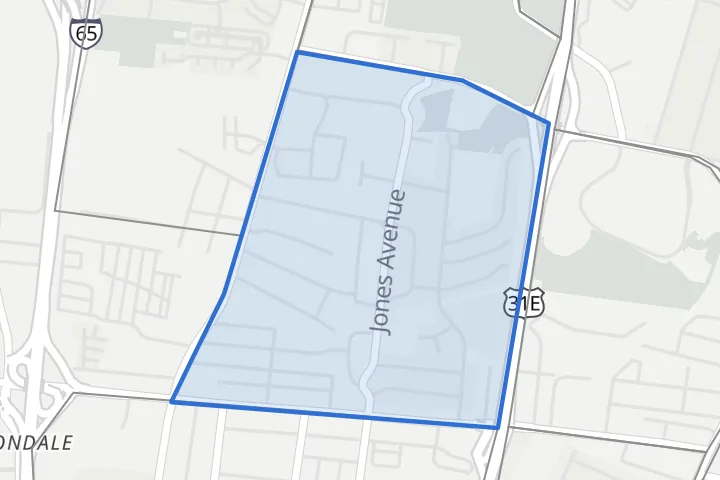
Oakwood
$329,700 median sale price, 3-month rolling
−35.0% vs. a year earlier · 3 sold · 9.93 months of supply
Open Oakwood →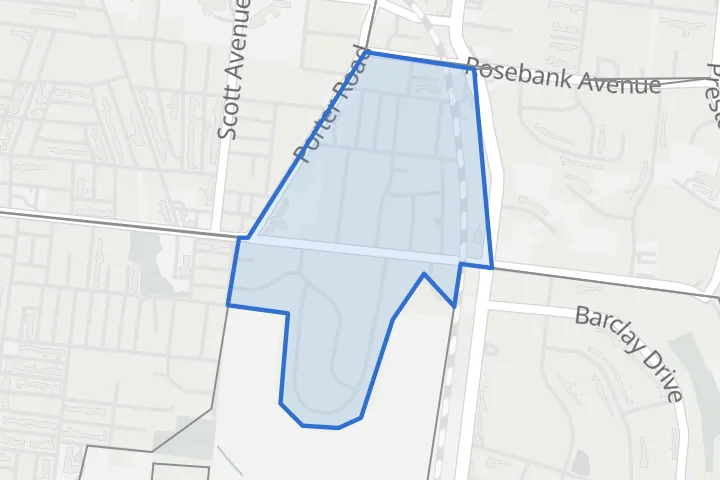
Rolling Acres
$771,450 median sale price, 12-month rolling
+7.2% vs. a year earlier · 0 sold · 4.86 months of supply
Open Rolling Acres →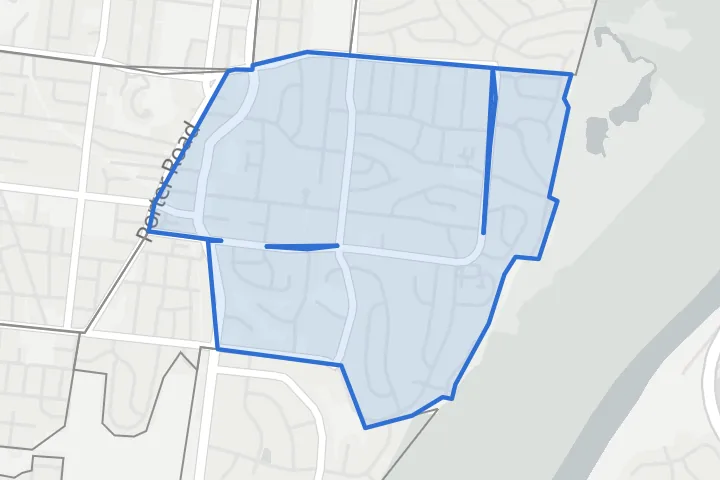
Rosebank & Porter Heights
$800,000 median sale price
+8.5% vs. a year earlier · 13 sold · 2.93 months of supply
Open Rosebank & Porter Heights →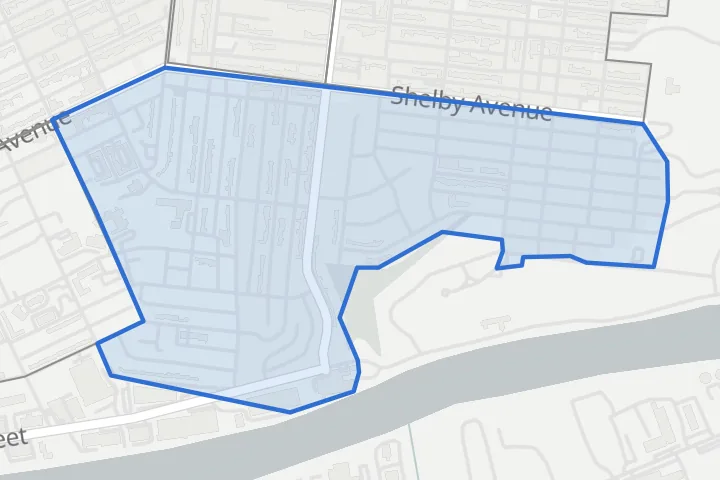
Shelby Hills
$512,500 median sale price, 3-month rolling
+20.7% vs. a year earlier · 6 sold · 5.96 months of supply
Open Shelby Hills →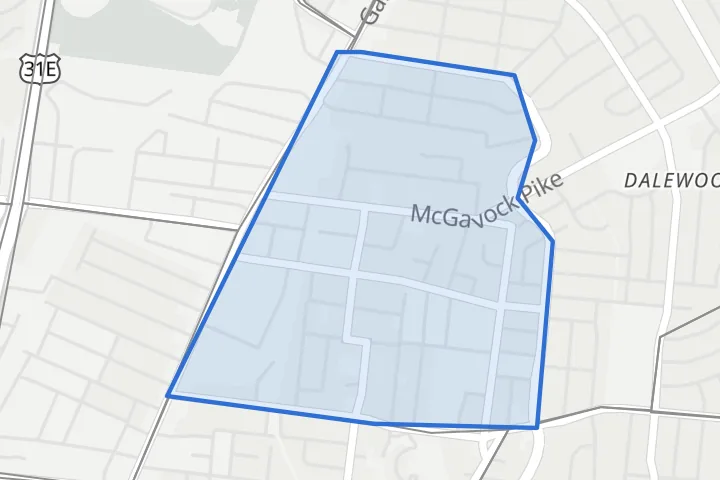
South Inglewood
$625,450 median sale price
+8.3% vs. a year earlier · 10 sold · 4.19 months of supply
Open South Inglewood →Snapshots: the neighborhood's outline (the public reference map, trimmed to meet its neighbors; the numbers are computed on Matthew's RealTracs drawing, which follows it closely) drawn in blue on the same street map as the map above — © OpenStreetMap contributors, © OpenMapTiles, served by OpenFreeMap. A median marked “3-month rolling” or “12-month rolling” is RealTracs' rolling figure, quoted because the month itself had fewer than 10 sales.
Source: RealTracs MLS, Analytics → Market Trends, the East Nashville map area (saved in RealTracs as “East- Whole”), residential single-family. Report dated October 28, 2026. Based on information from Realtracs® for the period September 1, 2021 through September 30, 2026. © 2026 Realtracs, Inc.